Dashboarding with pycsw and Apache Superset
24 November 2022 07:59:00 - by Paul van Genuchten
Dashboarding with pycsw and Apache Superset
At ISRIC - World Soil Information we’re in the process of adopting pycsw in a data workflow related to the EJP Soil project. One of the project requirenements is to provide a dashboard with catalogue statistics. On one hand to better understand the content of the catalogue, but also to identify gaps in data availability, by location, date and/or topic.
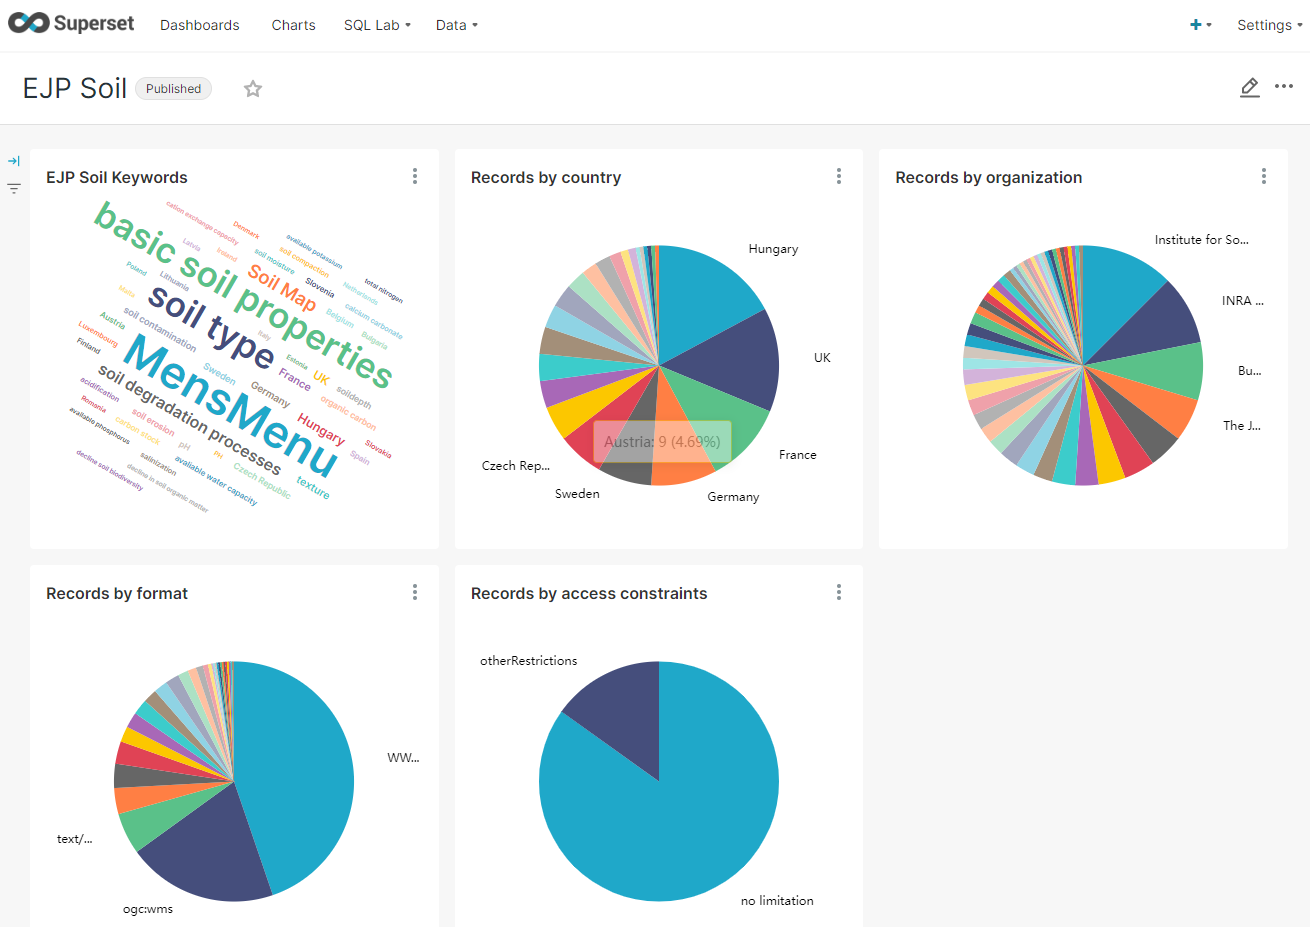
At ISRIC we’re already using Apache Superset in some of our projects, so it was relatively easy to add the pycsw database and set up the initial dashboard vizualisations. The initiative was appreciated, so these days we include the dashboard in each of the pycsw deployments.
Superset is a tool to create dashboard vizualisations on (relational) databases. It is not as full featured as Kibana or Tableau. But it does offer a considerable set of features and fits well in the Open Source aspect of pycsw.
In this blog I’ll give a quick starter on how to get started. Note that for production systems I recommend to set up proper authentication and Redis Cache for improved performance.
The starting point is https://hub.docker.com/r/apache/superset which provides good guidance on how to get started with superset.
The guidance suggests to install the World Bank's Health Nutrition and Population Stats samples. Which is a nice example,
but it is probably better to continue with a clean environment.
A SQLite driver is available by default, but you need to tweak the config file to allow connections to sqlite.
If you aim to connect to a pycsw PostGreSQL database, you need to add the psycopg2 driver to the docker image. Alexander Mencevice prepared some docker compose examples for setting up superset with postgres (and redis).
With a running superset instance you can now login and connect to the pycsw database. Setting up vizualisations on fields such as accessconstraints is quite straight forward.
- On datasets create a new dataset based on the connected database and select the
recordstable. - Then the dataset
explorescreen opens. - Select a chart type (for example
pie-chart). - Select group by
identifier. - On the simple tab in
metrics, selectaccessconstraintsandCount SaveandRun queryto get your first chart.
You can now add the chart to a dashboard.
Sharing the dashboard to the public can be done by publishing the dashboard. But also you need to give public access to the datasets behind the charts:
- Open the
List RolesinSettings. Editthe public role.- Start typing
datasource access on [My database][records](id:7)and select the relevant dataset from autocomplete.
Unnesting json type pycsw fields
In recent versions pycsw introduced a number of fields which contain json. Superset currently is not able to parse json and use it in charts. However you can set up saved queries and use them as datasets. In a saved query you can place advanced PostGres SQL to parse and unnest the json. JSON support in postgres has evolved quite a bit in recent versions. Note that you have to parse the json to string of record(set). In case of record(set) you need to join the result of the json parsing back to the original resultset (unnest). An example of a query to unnest the pycsw links:
SELECT identifier, k.name, k.protocol
FROM
  records r,
  json_to_recordset(cast(r.links as json)) as k(name text, protocol text)
Saved queries are created in the SQL lab. Click Explore once the query is ok to save it and create a vizualisation on it. Note that you have
to give access to public on the saved query for it to be available publicly.
© Tom Kralidis, Angelos Tzotsos 2010 - 2026. Website Ryan Clark 2013.  Powered by Jekyll
Tweet
Powered by Jekyll
Tweet